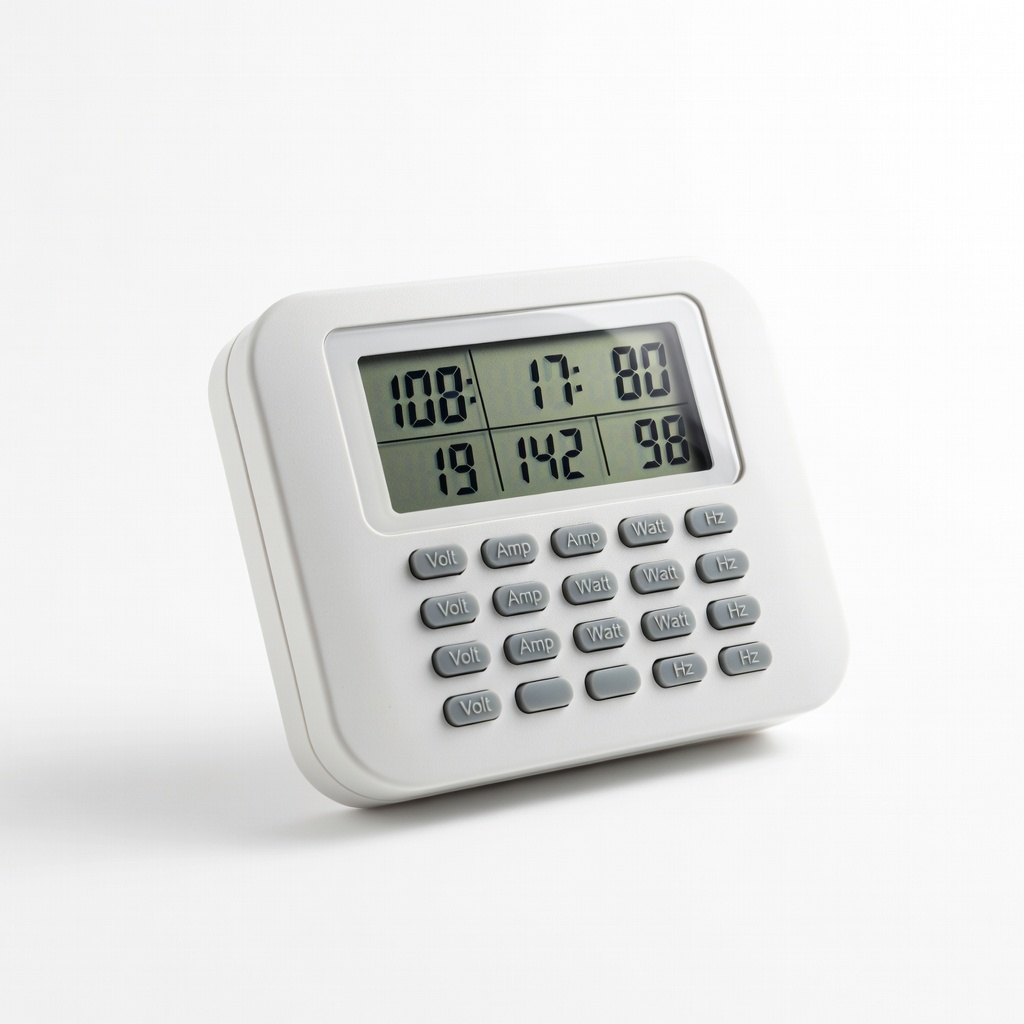
P3 Kill A Watt Electricity Usage Monitor
Plug into fridge/outlets to spot hogs instantly.
$25.99
P3 Kill A Watt Electricity Usage Monitor Accurately measures any plugged appliance's watts/kWh in real-time—perfect for verifying guide rankings.
Get the App
Better experience on mobile
Uncover the top energy-hogging home appliances and simple ways to slash your electric bill by 20-30%.
Struggling with skyrocketing electricity bills? You're not alone—U.S. households spend an average of $1,500 annually on power, with hidden appliance hogs driving up costs. This guide breaks down the biggest culprits, ranked by real-world data from the U.S. Department of Energy.
You'll learn how appliances consume power (in kWh), why certain ones dominate your bill, and actionable steps to measure and cut usage. No technical expertise needed—just 15 minutes to gain insights that could save hundreds yearly.
Expect clear explanations, rankings, examples, and tips tailored for beginners, plus product recs to track your usage effortlessly.
Estimated Time: 15-20 minutes Difficulty: beginner
Electricity usage is measured in watts (W) for power draw and kilowatt-hours (kWh) for total energy over time—your bill charges per kWh (avg. $0.15/kWh).
Analogy: Watts are like gallons per minute from a hose; kWh is total water used in an hour. A 100W bulb on 10 hours = 1 kWh ($0.15). Appliances vary: small ones sip power, giants guzzle it.
Why it matters: Knowing this demystifies bills. Expect top users to eat 50-70% of home energy.
💡 Tips:
Air conditioners, furnaces, and heat pumps top the list at 30-50% of home usage (avg. 2,000-3,000 kWh/year).
In hot summers or cold winters, they run constantly. Example: Central AC (3-5 tons) pulls 3,500-5,000W. Standby 'phantom' power adds 100 kWh/year.
Why #1: Climate control fights weather 24/7. In mild climates, still 20-30%.
⚠️ Warnings:
18-25% of usage (avg. 4,000 kWh/year). Electric tank models heat 40-50 gallons constantly.
Analogy: Like a pot always simmering—keeps water at 120°F, reheating as used. Tankless saves 30% but costs more upfront.
Daily showers, laundry spike it. Low-flow fixtures cut demand.
💡 Tips:
10-15% (1,200-2,000 kWh/year). Runs 24/7 compressor cycles on/off.
Example: 18 cu ft fridge uses 500-700 kWh/year. Old models (10+ years) double that due to poor seals/inefficient compressors.
Doors left ajar or hot food inside ramps it up.
⚠️ Warnings:
5-10% (800-1,000 kWh/year). Electric dryers heat coils at 5,000W for 45-60 min/load.
Gas dryers use less electricity (just fan). Tip: Full loads save cycles.
Why high: Heat escapes; vent clogs waste 20%.
💡 Tips:
3-6% each for oven/range, dishwasher (500-1,000 kWh/year). Oven bakes at 2,500-5,000W.
Analogy: Microwave (1,000W, 5 min) vs. oven (1 hour)—microwave wins for small jobs.
Dishwashers use less if air-dried.
Lighting (5%), washers (300 kWh/year), TVs/standby (200-500 kWh). LEDs slashed lighting from 15% to 5%.
Phantom power: Chargers/TVs draw 5-10W idle—10% total waste.
Pool pumps/ EV chargers can rival top ranks.
💡 Tips:
Plug monitors into outlets or use whole-home meters. Check bills seasonally.
Action: List appliances, estimate runtime x watts /1000 = kWh/day x 30.
Track 1 week for surprises—expect HVAC/water to confirm 50%+.
Problem: Bill spikes unexpectedly
Solution: Check for vampire loads or failing compressor—use monitor to isolate.
Problem: Monitor shows impossible high usage
Solution: Verify wattage rating; continuous draw >1500W needs electrician.
Problem: Can't access whole-home data
Solution: Start with plugs on suspects; apps like Sense for circuits.
Accurately measures any plugged appliance's watts/kWh in real-time—perfect for verifying guide rankings.
Best for: Plug into fridge/outlets to spot hogs instantly.
Price Range: $25.99
App tracks usage remotely, schedules off-peak, cuts standby—easy beginner WiFi setup.
Best for: Monitor dryer/lamps; automate savings.
Price Range: $14.99
Whole-home AI detects appliances by pattern—no plugs needed; graphs bill drivers.
Best for: Ongoing tracking for HVAC/water heater insights.
Price Range: $299
Auto-optimizes HVAC (30% savings); learns habits for beginners.
Best for: Tame #1 energy hog effortlessly.
Price Range: $199-$249
Plug into fridge/outlets to spot hogs instantly.
P3 Kill A Watt Electricity Usage Monitor Accurately measures any plugged appliance's watts/kWh in real-time—perfect for verifying guide rankings.
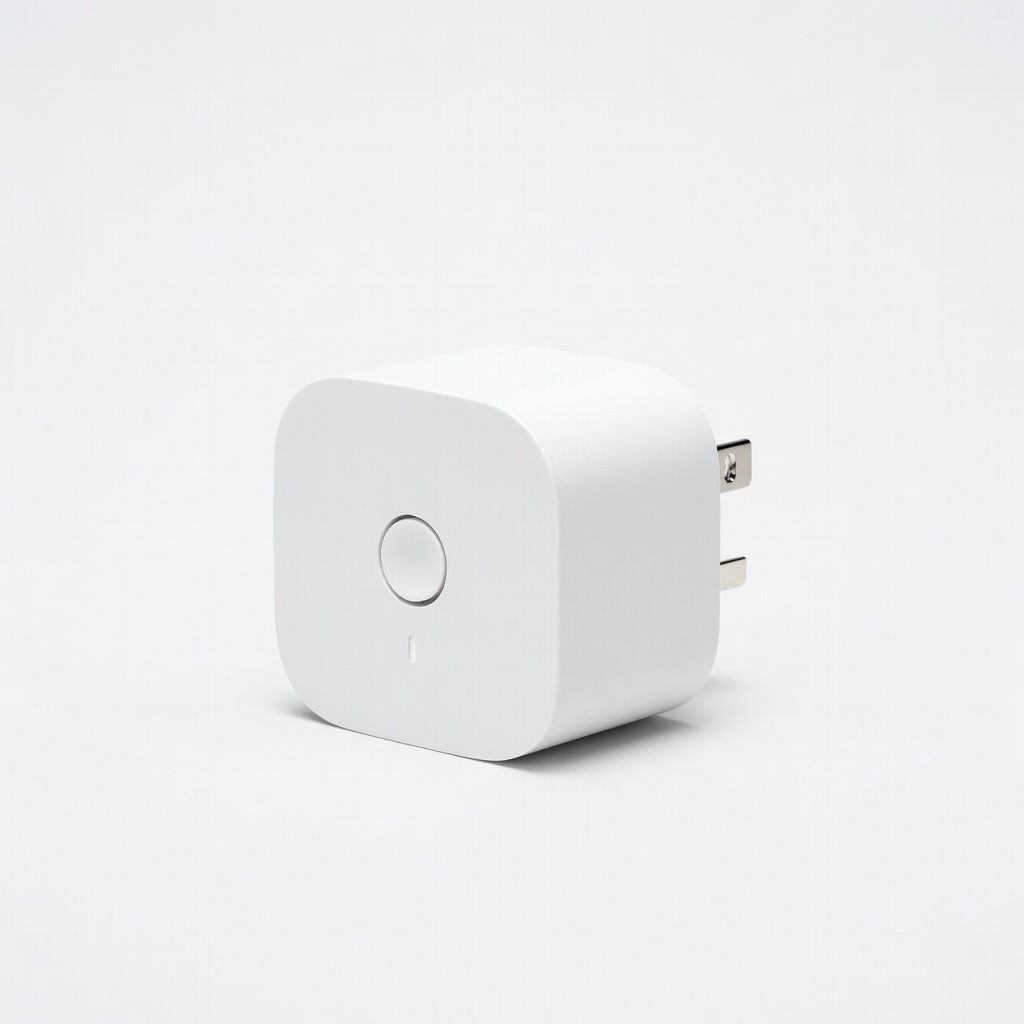
Monitor dryer/lamps; automate savings.
TP-Link Kasa Smart WiFi Plug Mini (HS103) App tracks usage remotely, schedules off-peak, cuts standby—easy beginner WiFi setup.
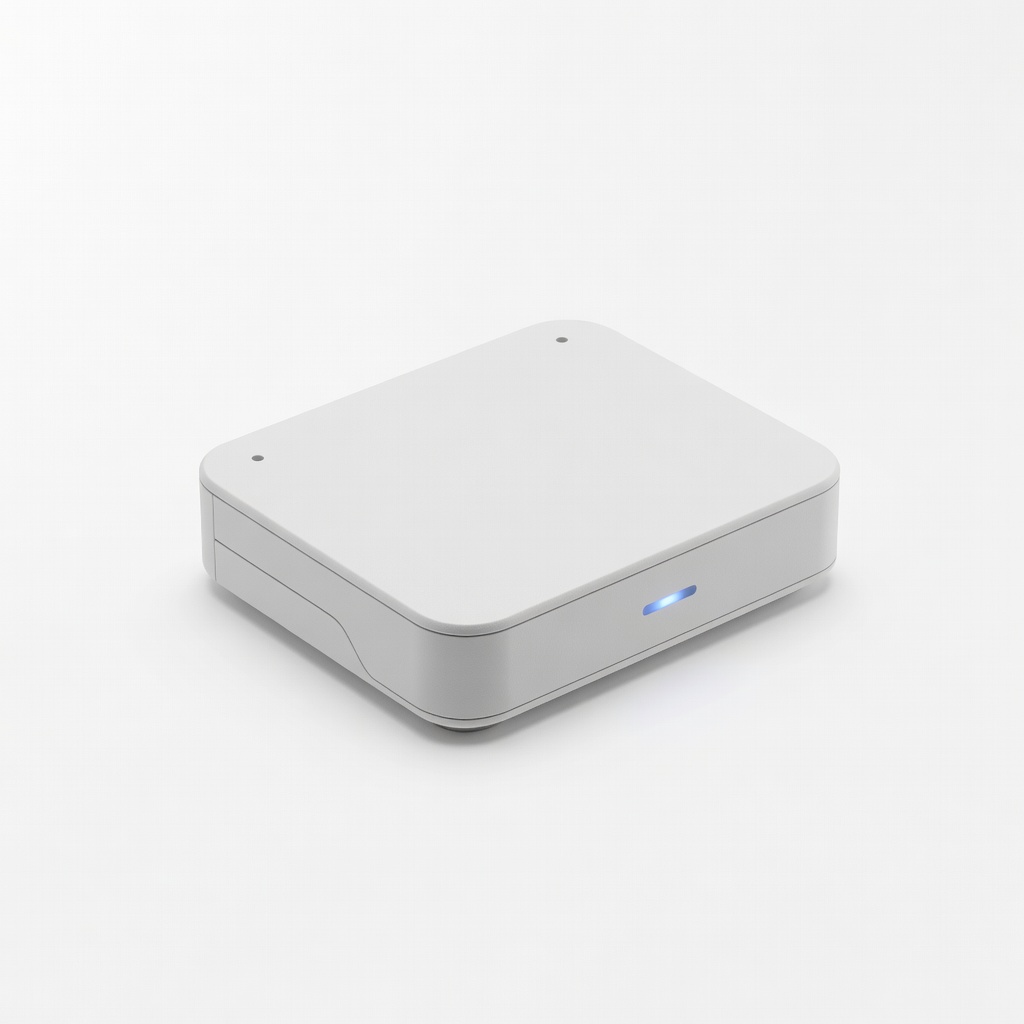
Ongoing tracking for HVAC/water heater insights.
Sense Energy Monitor Whole-home AI detects appliances by pattern—no plugs needed; graphs bill drivers.
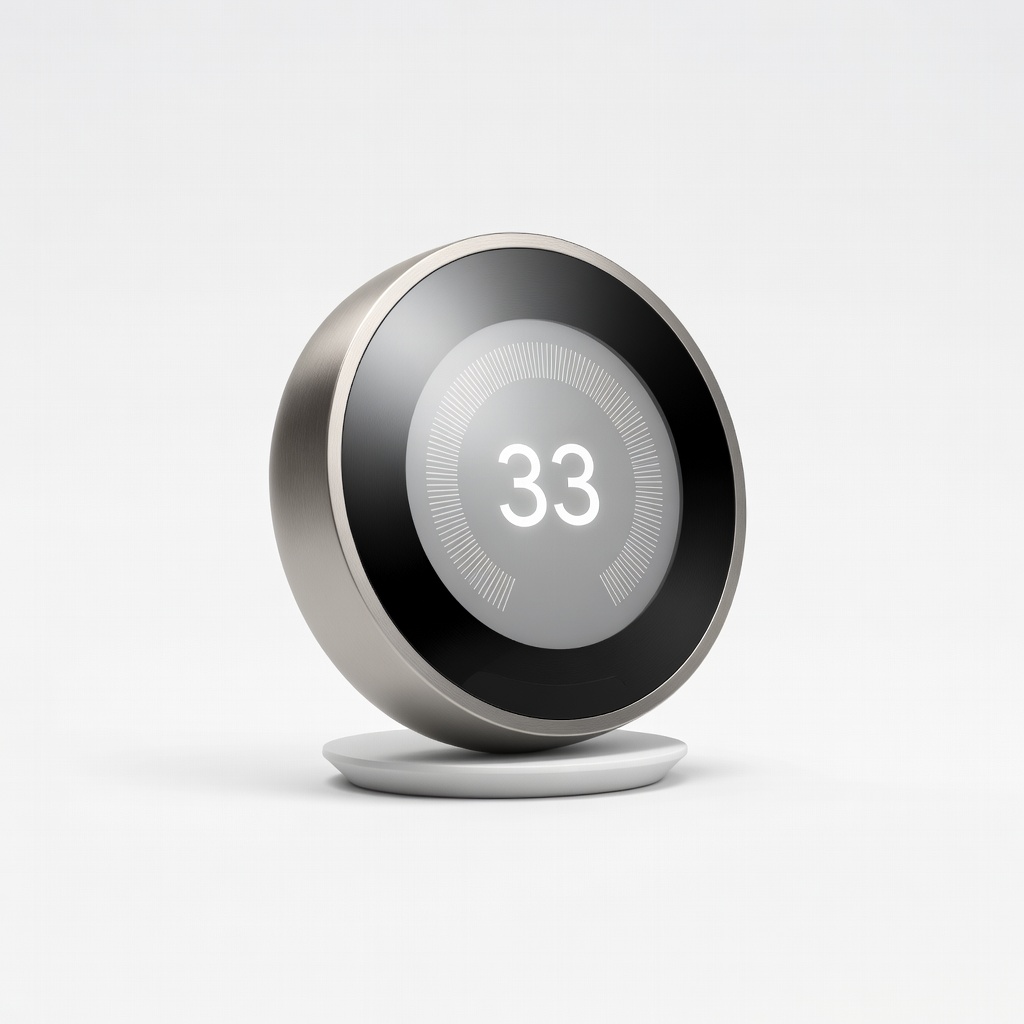
Tame #1 energy hog effortlessly.
Google Nest Learning Thermostat Auto-optimizes HVAC (30% savings); learns habits for beginners.